Subscribe to The Adaptive Zone Podcast…
Working with runners every day, you start to notice patterns. When I ask my clients about their training, there is an extremely common pattern. Most runners are not using any kind of system to determine how fast to run each workout. In fact, the majority of runners that I see will do all of their runs at roughly the same pace. They will speed up to do the sprints (if that’s what their running group is doing), but otherwise, they will settle into the same pace for every run.
Now, you may be wondering, what’s so bad about that? Well, if you’re looking to improve your running performance, you are leaving a lot on the table if you train this way. In the last post in this series, we discussed the various energy systems that we use when we run.
Previous Module
You should check out that post/podcast to understand this in more detail but we’ll examine the basics in a little anecdote here.
The 10k: A Tale of Lactate Threshold
In the previous post, we examined the energy systems using a story about my cousin and I in a 5k race. Now, I don’t want to seem too self-centred, so in this story, I will not be the protagonist. Instead, we’ll invent a new runner…Carri. We’re going to examine Carri’s performance in the 10k and how it relates to her lactate threshold. Then we’ll discuss how Carri can alter her training in order to improve her lactate threshold pace and beat her 10k PR.
Carri is 37 years old and a big fan of 10k races. She’s done many over the years but has always struggled to get her time under 1 hour. This is a really common barrier. In fact, a 2020 study showed that the average finish time for the 10k in the US is 01:01:00. That’s 1 hour and 1 minute! Very frustrating. As it happens, 1 hour and 1 minute is Carri’s PR for the 10k. It’s been the same for 5 years now.
Carri has set her sights on breaking the 1-hour barrier. She’s got 4 months until her goal race so she feels like it’s realistic. First up, she’s going to do a time trial to see where she’s at right now.
10k Time Trial
Carri sets off. She settles into a 6:30 min/km pace immediately. At first, this feels hard, but she’s felt that before and knows it will pass. After a couple of minutes, her breathing settles into a comfortably hard rhythm. Let’s zoom into her muscles to see what’s going on…
As usual, the neuromuscular junction is sending messages into the muscle cell to tell it what to do. Contract harder, faster, more, more, more! The muscle cell is doing its best to keep up. During the first couple of minutes of the race, the muscle cell has burned through all of the available Adenosine Triphosphate (ATP) and Creatine Phosphate (CP) using the Phosphagen Energy System.
Now the muscle cell needs more ATP. It’s directly burning some of the available glucose molecules via the Glycolytic System. This is producing 2 ATP molecules for each molecule of glucose, however, it’s also producing lactate as a byproduct. This lactate is starting to build up within the cell.
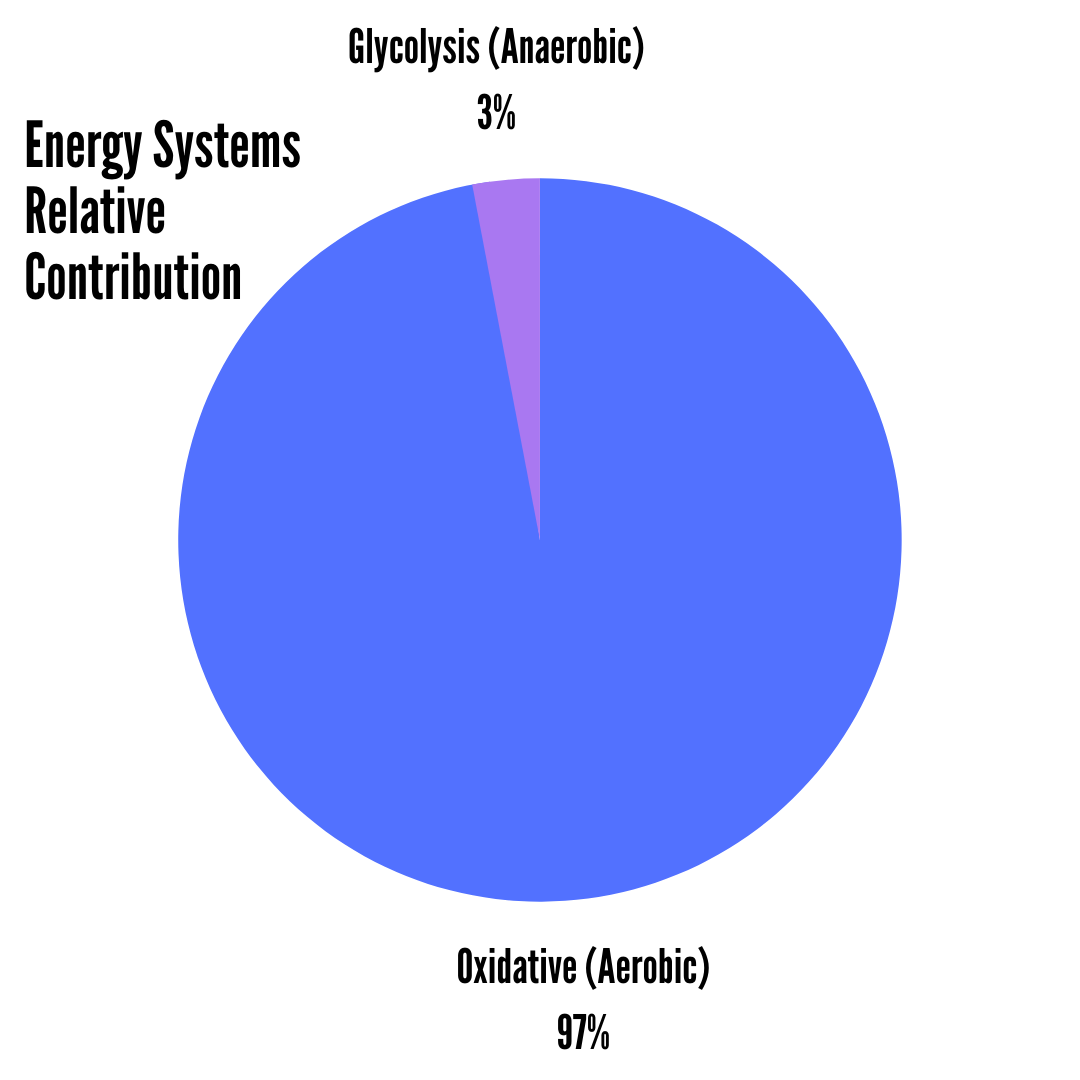
Thankfully, only a small percentage of the ATP is being generated by this glycolytic system, probably less than 5%. The other 95% + is coming from the mitochondria. They’re using the oxidative system to produce a whopping 34 molecules of ATP for each glucose molecule, without producing any lactate. Unfortunately, this oxidative system is slow, and it needs oxygen. In order to sustain the 6:30 min/km pace, Carri has to quickly grab some ATP from the glycolytic system, meaning some lactate is being produced.
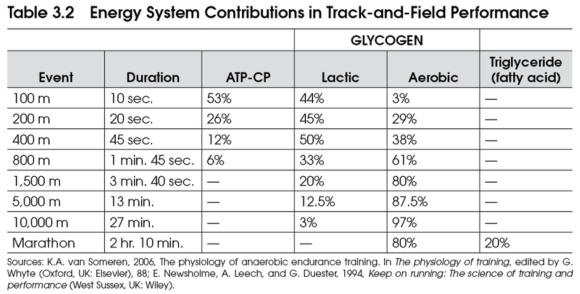
As we can see in the table above, at her 10k pace Carri will be getting roughly 3% of her energy from glycolysis, which generates lactate. The other 97% will be coming from the mitochondria, via the oxidative system. At her 6:30 min/km pace, Carri can clear the lactate reasonably well.

Carri clears this lactate by shuttling it off to the liver via the bloodstream. In the liver, it is turned back into glucose, which is sent back to the muscles to burn for energy. This is known as the Cori Cycle.
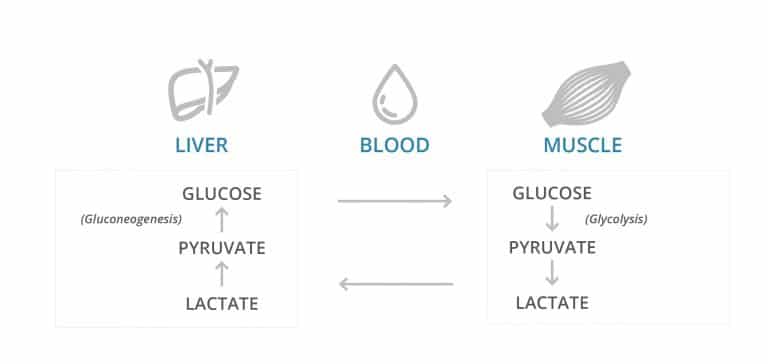
At this point, Carri’s muscle cells are producing the energy for contractions via two systems, the glycolytic system (which is anaerobic and produces lactate) and the oxidative system (which is aerobic and uses oxygen).
Carri decides to push it a little. She increases her pace to 6:15 min/km. To continue muscle contractions at this rate and force, her muscle cells don’t have enough time to use the oxidative system as much. So instead of 3% from glycolysis, she gets about 6% from glycolysis.
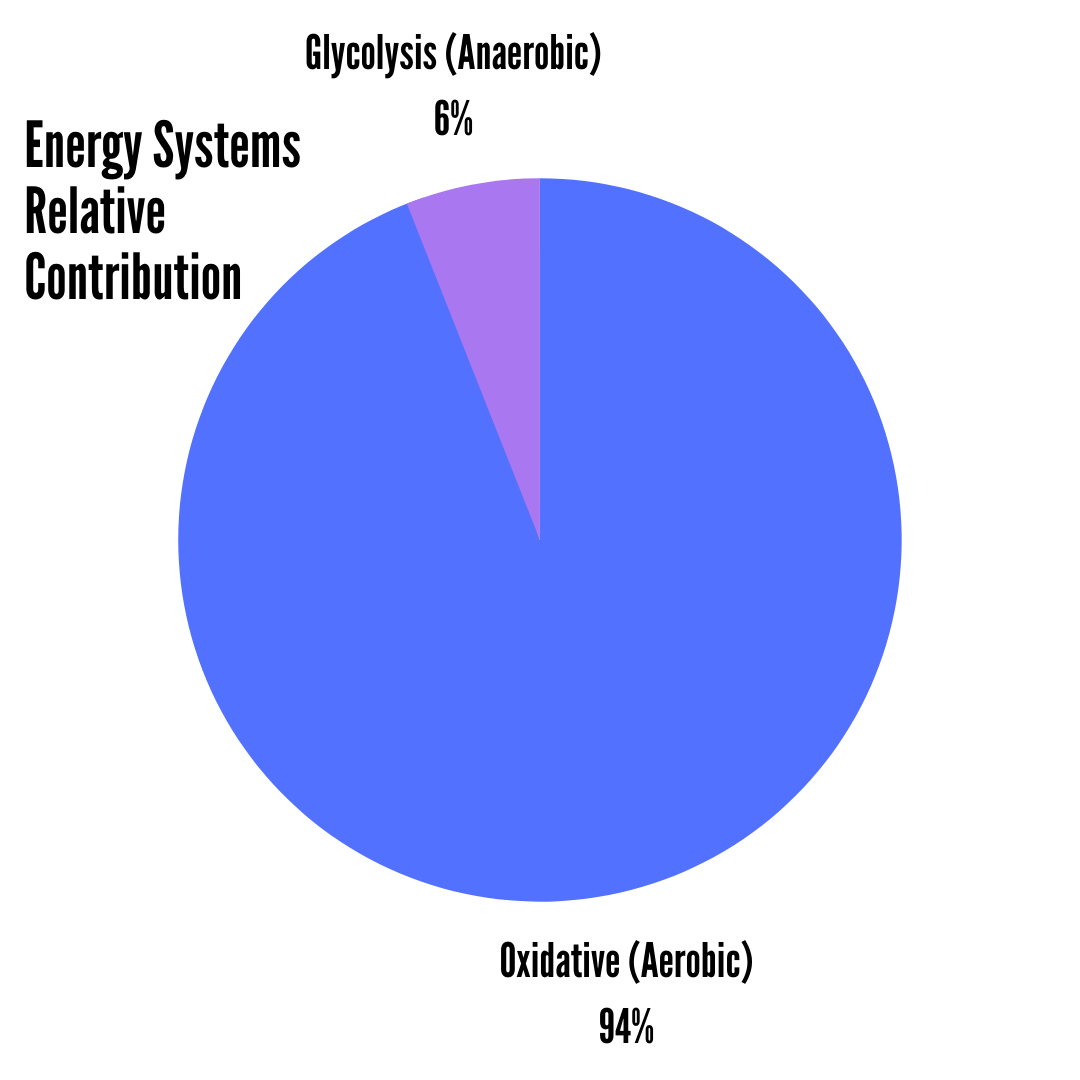
This increase in anaerobic glycolysis produces more lactate. Now she’s struggling to clear it all.

Carri is breathing harder, but it feels sustainable. At this point, she couldn’t talk in full sentences anymore. This is sometimes referred to as The Talk Test. This is a crude test used to approximate if a runner’s effort is close to their lactate threshold.
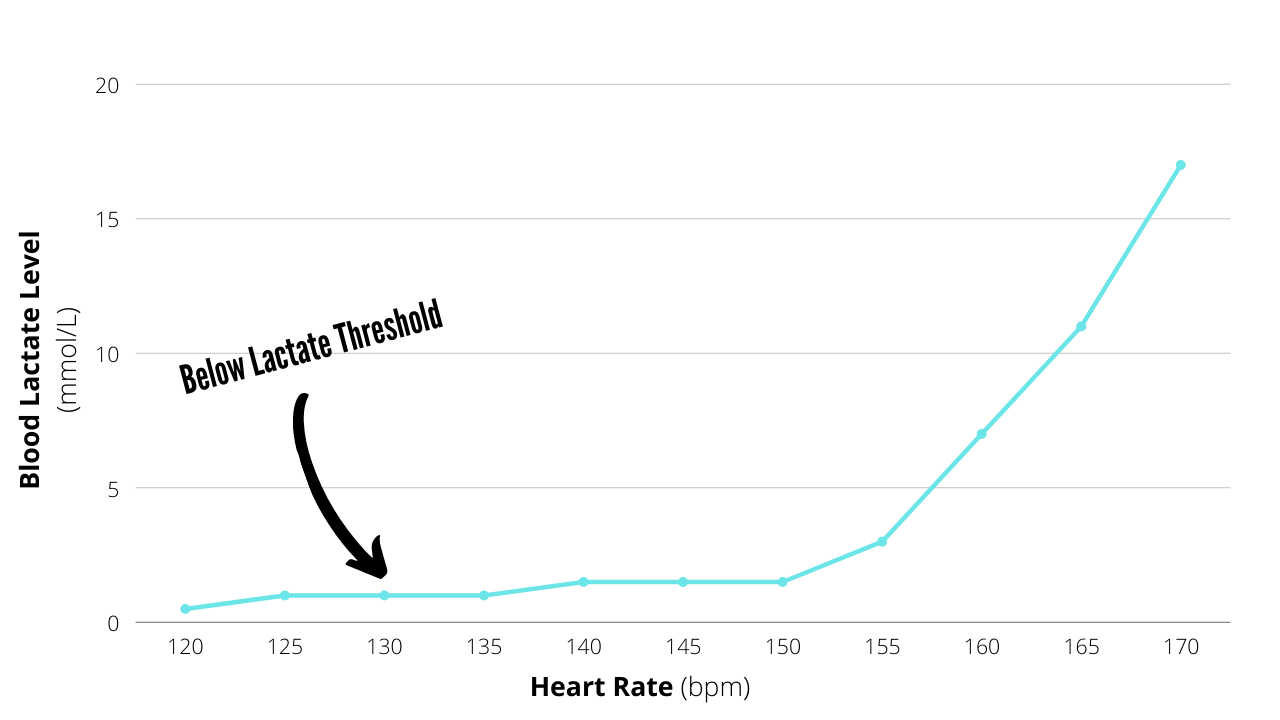
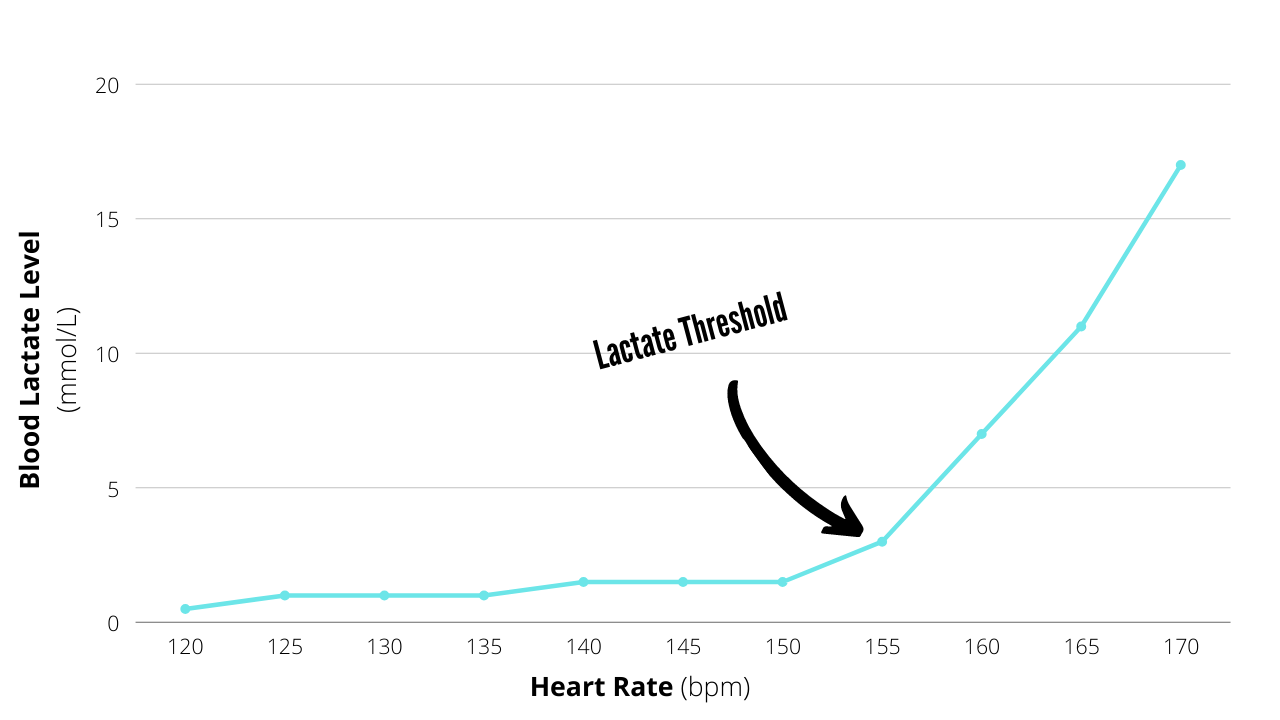
If we were to plot a graph comparing her heart rate to the accumulation of lactate in her blood, she would be right at the corner of the hockey stick. The inflection point at which lactate starts to accumulate rapidly on the graph is the lactate threshold, sometimes referred to as the anaerobic threshold.
If you were to go for a lactate threshold test, exercise physiologists would periodically draw your blood and measure the lactate concentration as you steadily increase your effort. The lactate threshold is generally accepted as the heart rate or pace at which blood lactate levels rise above 4 mmol/L, however, there will be significant variability in this number. So exercise physiologists will plot a graph and look for the point where lactate concentration starts to rise. That may be at 4 mmol/L, but it could be at a different concentration.
Carri increases the pace a little more, now she’s at 6:00 min/km. If she can hold this pace, she’ll hit 60 minutes for the 10k and break her PR. However, now she’s asking her muscle cells to contract harder and faster. The oxidative system would be too slow to generate the ATP quickly enough to sustain this pace. Carri’s muscle cells begin to generate more energy for the contractions via the glycolytic system. Now she is getting 12% of her ATP from anaerobic glycolysis.
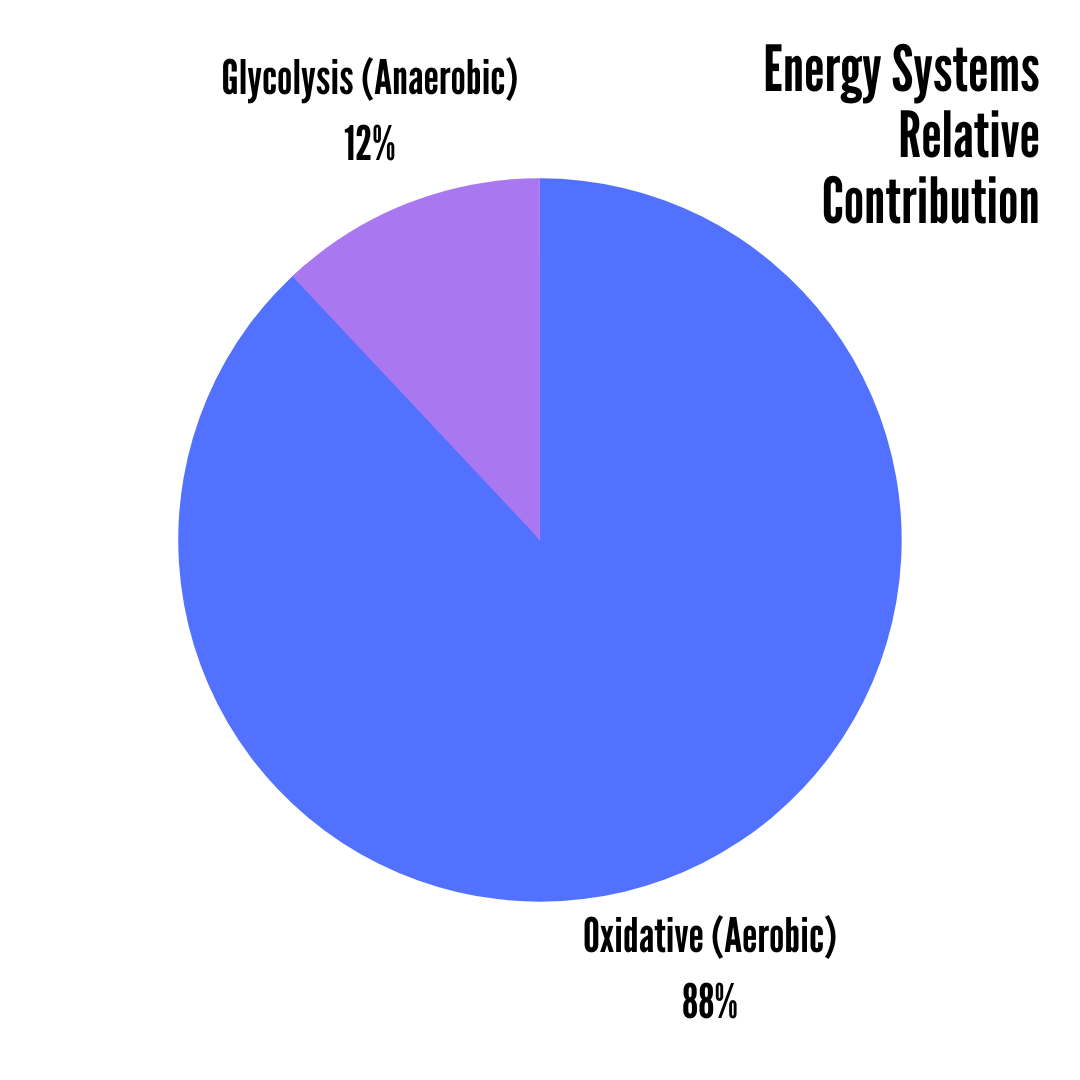
Now there is more lactate being generated and Carri can no longer clear it as fast as it’s produced.

Carri has crossed the lactate threshold. The concentration of lactate in the blood is now starting to rise.
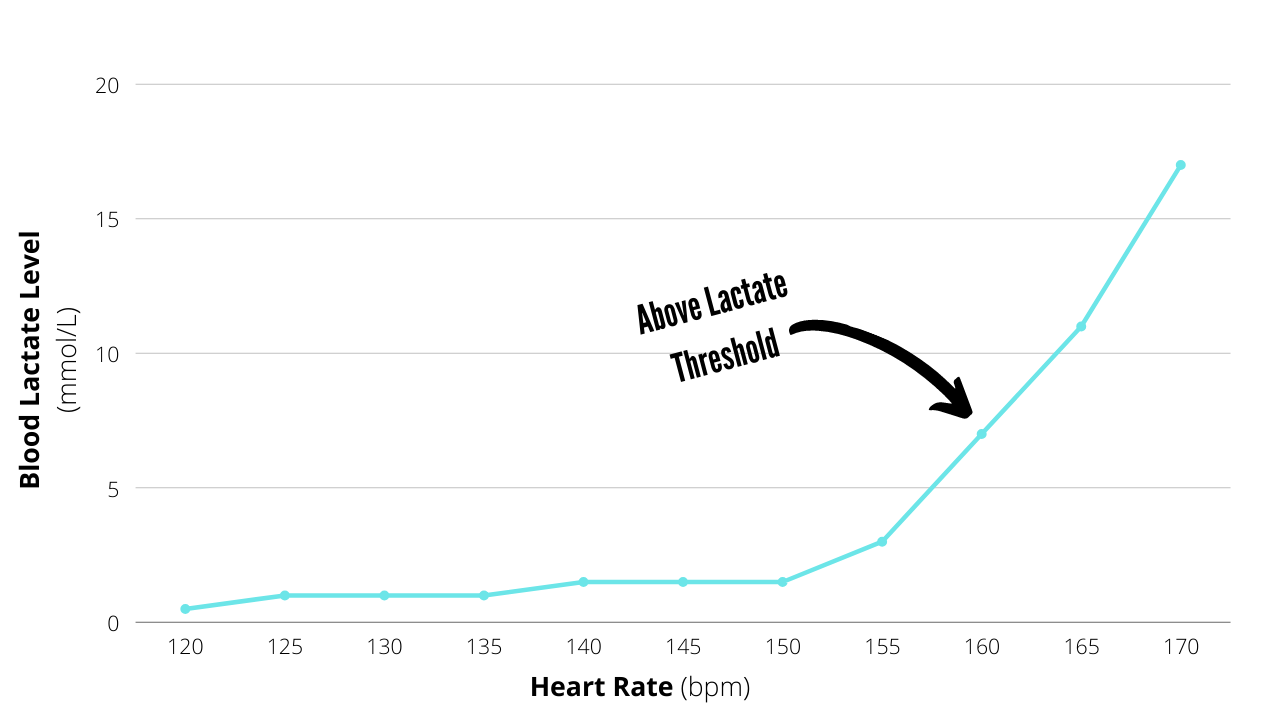
At this point, the clock is ticking. Within an hour, Carri will slow down or stop. Once you cross the lactate threshold, the clock starts. You have about 30-60 minutes at lactate threshold pace. Fitter runners can hold lactate threshold pace for 60 minutes, whereas less-fit runners can only hold it for about 30 minutes.
Bonus Course Content
Muscle Acidosis
Now, most people beleive that it’s the build-up of lactic acid in the muscles that causes fatigue. As we discussed in the previous post on energy systems, that’s not really true. So why is the clock ticking once we cross the lactate threshold? It’s complicated, but it would seem that muscle acidity is the main reason.
As the muscle cells break down ATP into ADP they release hydrogen ions. This process is known as ATP hydrolysis as water is used to break down the ATP. The hydrogen ions that are released are positively charged and will start to lower the pH, this is known as muscle acidosis. The muscle acidosis prevents calcium (Ca) ions from initiating muscle contractions. Higher hydrogen ion concentration will also inhibit anaerobic glycolysis, preventing the production of ATP. These factors combine to force us to slow down and eventually stop.
In this way, the build-up of lactate is a proxy measurement for the build-up of hydrogen ions. It’s not the lactate that makes the muscles acidotic (because lactate is an alkali) it’s the hydrogen ions. This video explains it well…
Carri can’t sustain the 6:00 min/km pace for the full hour. Her muscles burn intensely due to the hydrogen ion build-up. Her muscle contractions are inhibited by muscle acidosis and she inevitably slows her pace. She finishes her 10k time trial in 1:03:12. Three minutes away from breaking the one-hour barrier.
A week later she’s ready to start training in earnest. She’s been reading about training zones and she knows that her usual approach of just running each run as fast as she feels able to is not the optimal strategy. She’s been keeping an eye on the heart rate zones on her GPS watch, however, they seem to be a little off. She’s not sure what exactly each zone is supposed to feel like, but when her watch shows zone 2, she’s walking!
Carri has read that most GPS watches and other running apps will use the formula 220 – age to determine your max heart rate. From there, they will use percentages of the max heart rate to determine training zones. This method will usually work reasonably well, however, the 220 – age formula is based on the average runner. So it works well for people with a typical max heart rate, but not so well if you have an unusually high (or low) max heart rate. A random population of runners will usually have a normal distribution (or bell curve distribution) when you plot their max heart rate on a graph.
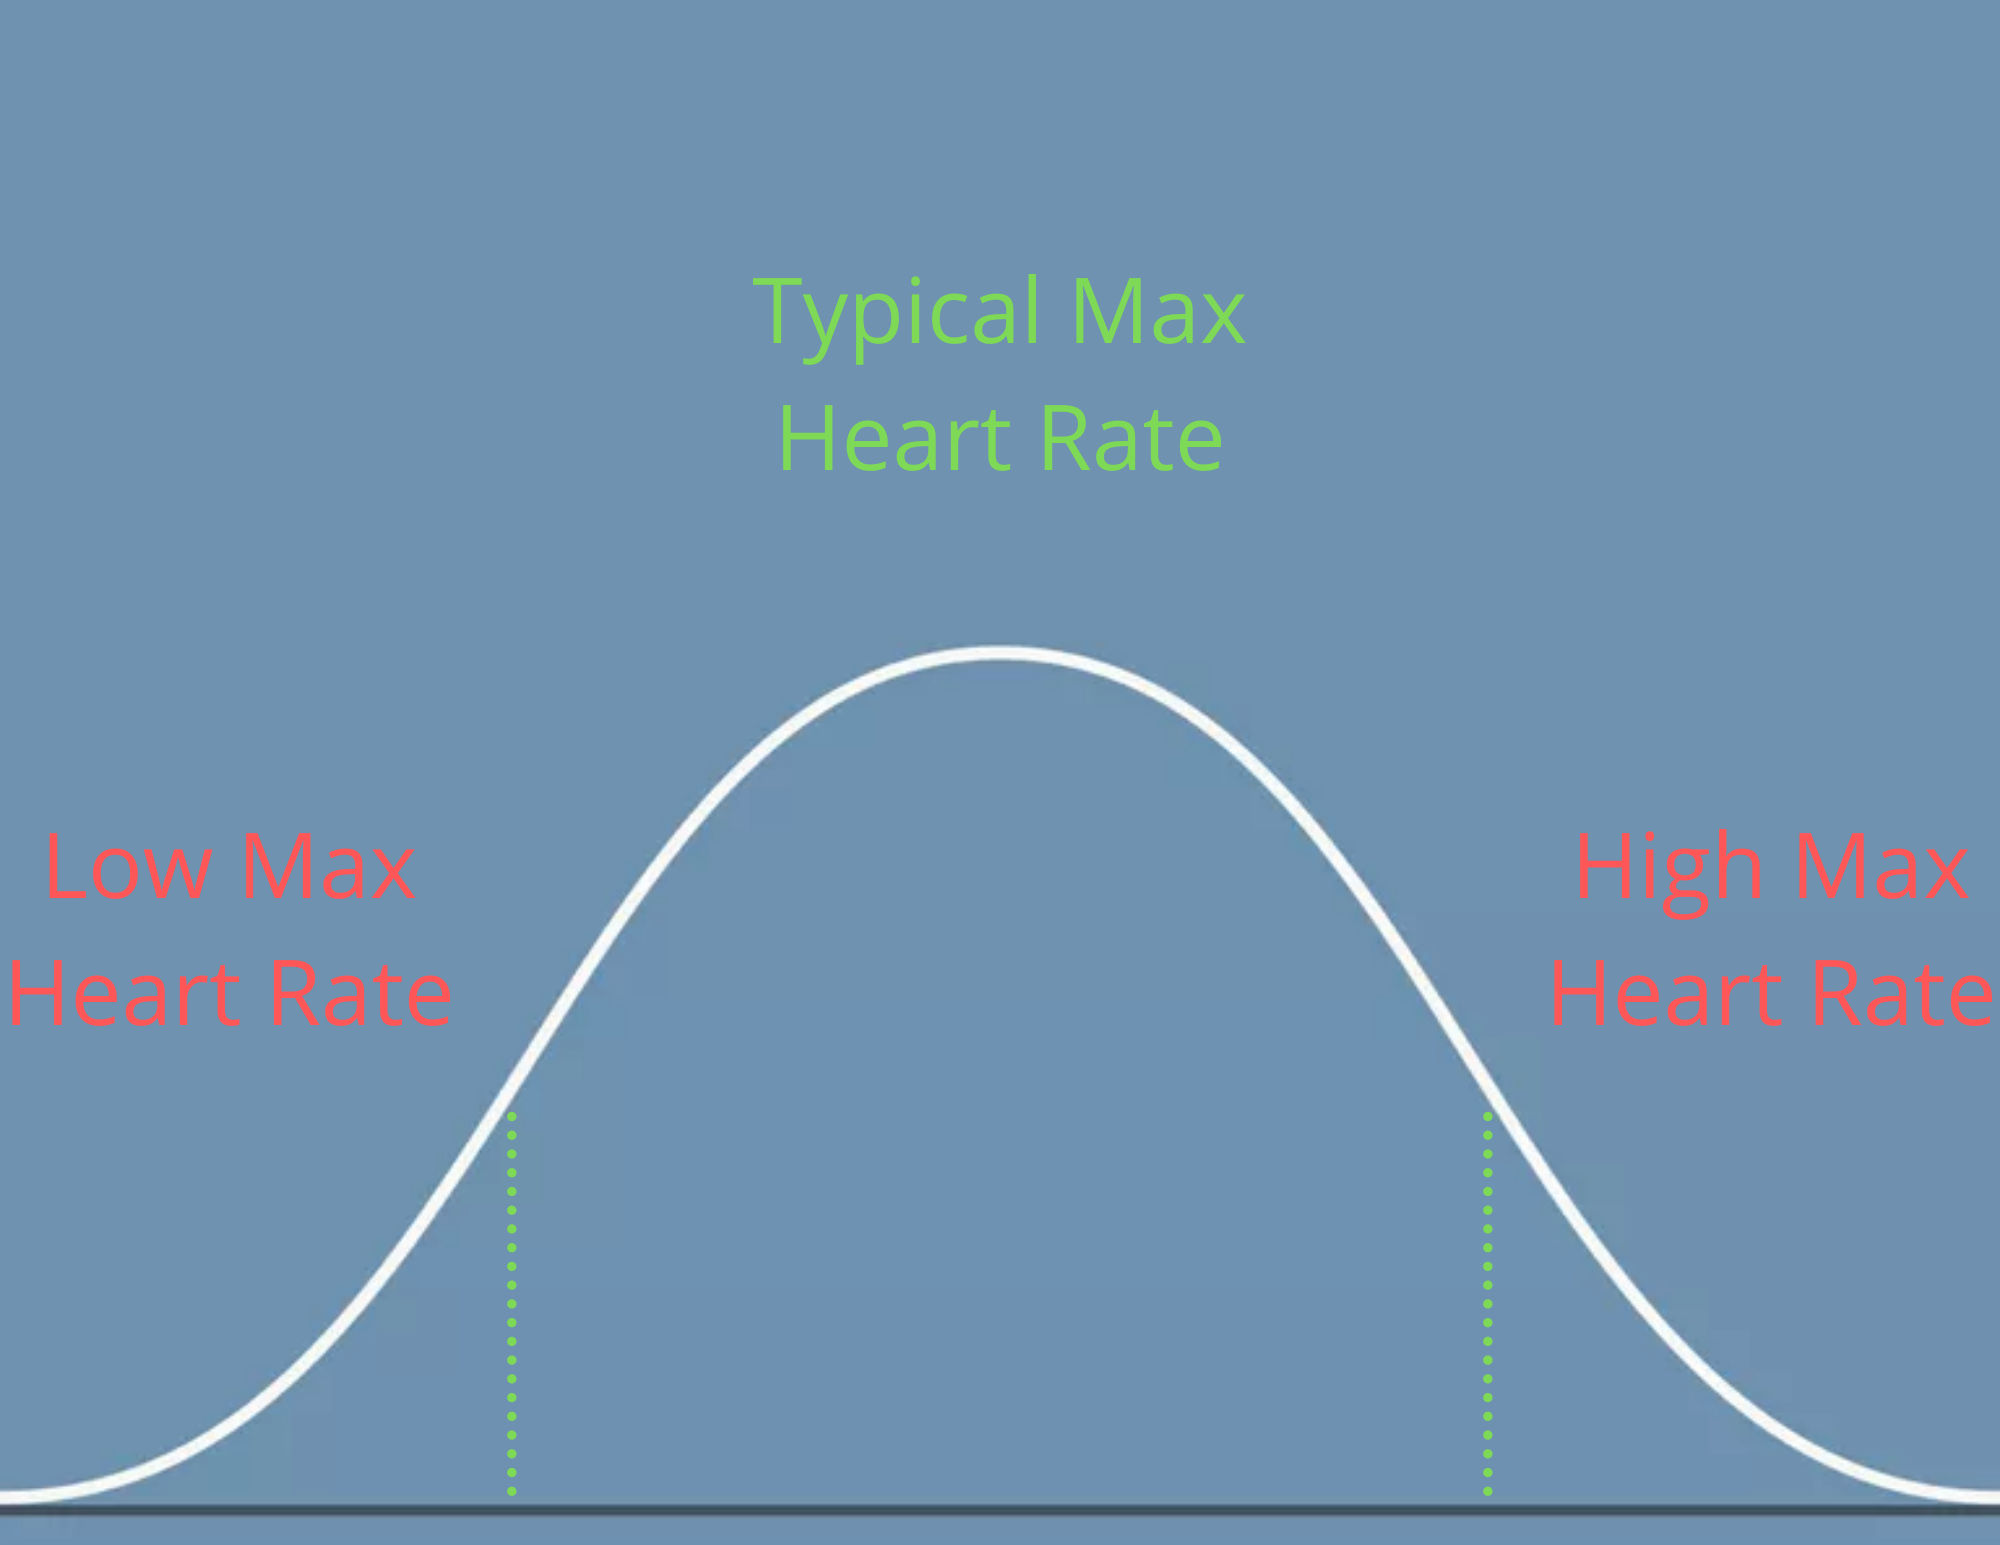
Carri has resolved to determine her own training zones for heart rate and pace. It’s recommended that all runners do this at least once a season, although every 4-8 weeks is preferable. In order to determine lactate threshold heart rate and pace, Carri will need to do a Lactate Threshold Field Test.
Lactate Threshold Field Test
So we know that the pace that we can hold for about 60 minutes would be pretty close to the lactate threshold. We call that the lactate threshold pace. So if you run as fast as you can sustain for one hour, your average pace for that hour is your lactate threshold pace. Now, if you’re wearing a heart rate monitor while you do it, you can look back at your average heart rate for that 60 minutes. That would be your lactate threshold heart rate.
Carri’s 10k time trial took almost exactly one hour (1 hr 3 min). So her average pace during that 10k time trial would be a very good estimate for her lactate threshold pace. Her finishing time was 1:03:12, making her average pace 6:19 min/km. Her average heart rate was 163.
It would be reasonable to use these values as Carri’s lactate threshold pace and heart rate. However, that was her average pace and heart rate for 1 hour and 3 minutes, not 1 hour. So that will introduce a little error. Also, sustaining your max effort for 60 minutes is extremely hard, even if you are very motivated. Runners can often manage it in a race, but try doing a 60 minute time trial on your own. It’s very difficult to sustain that effort psychologically, this would introduce more error.
Happily, there is an easier field test than the 60-minute time trial. As it turns out, whatever pace you can sustain for a 20 minute time trial, is roughly 5-9% faster than the pace you can sustain for a 60 minute time trial. So we can use a 20 minute time trial and then just make the pace 9% slower and the heart rate 9% lower (Lillo-Beviá 2019, Borszcz 2019).
You can do this bit too. Here’s how you do it…
Step 1: 20-minute Lactate Threshold Field Test
- 10-minute warm-up
- A gentle jog – you should be able to talk in full sentances
- Don’t start your GPS watch or phone app yet
- 20-minute all-out effort
- Start your GPS watch or app and set off
- Try to hit a consistent pace, the maximum pace you feel you can sustain for the whole 20 minutes
- When you hit 20 minutes, stop your GPS watch or phone app
Step 2: Determine Lactate Threshold Heart Rate and Pace
- Note your average pace and average heart rate for the 20-minute test
- Make the pace 9% slower and the heart rate 9% lower. This can be a little tricky math-wise, so it’s easier to just plug those numbers into the my zone calculator
Carri does her 20-minute field test and runs 3.44 km with an average pace of 5:48 min/km. Her average heart rate during the 20-minute test was 170. She plugs those numbers into my zone calculator.

Now Carri knows that her lactate threshold pace is 6:19 min/km and her lactate threshold heart rate is 155 bpm. She can now use those values with any training plan that uses lactate threshold heart rate or pace to determine training zones. Some of the more popular examples are…
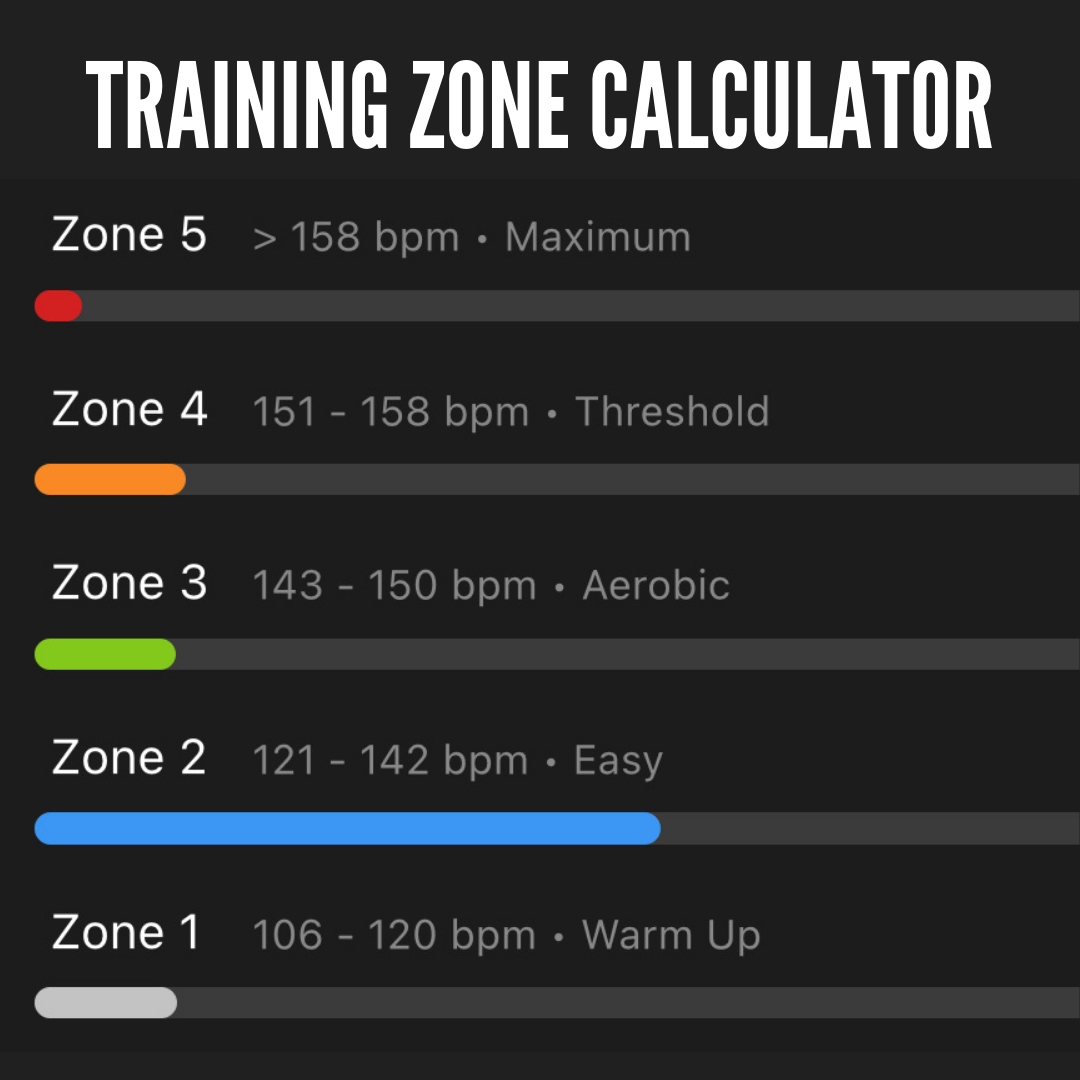
She could also use the training zones from my zone calculator, which are based on a blend of some of the above methods.
Zone Based Training
Now, I intend to explore zone-based training in more depth in the coming weeks. You can check out my Running Fundamentals Course for more on that. For this article though, it would be too much to explore all of the modifications Carri could make to her training in order to beat her 10k PR. However, since Carri’s training is pretty basic right now, simply adding some variation in her training intensity is likely to elicit a training response.
Think of it this way, an Olympic 10k runner will have very few ways they could improve their training. They will have a team of seasoned professionals working to optimize their training schedule, workout design, periodization, biomechanics, strength training, nutrition, mental strategies etc. If they are to improve, it’s likely to be with tiny little tweaks, because their training is already so good.
When your training sucks, this is not such a problem. It’s the law of diminishing returns. If your training sucks, and you put in a little effort to make it better, you will see a fairly large improvement in performance. However, if your training is excellent, even a herculean effort to improve your training may only yield minimal improvements in performance.
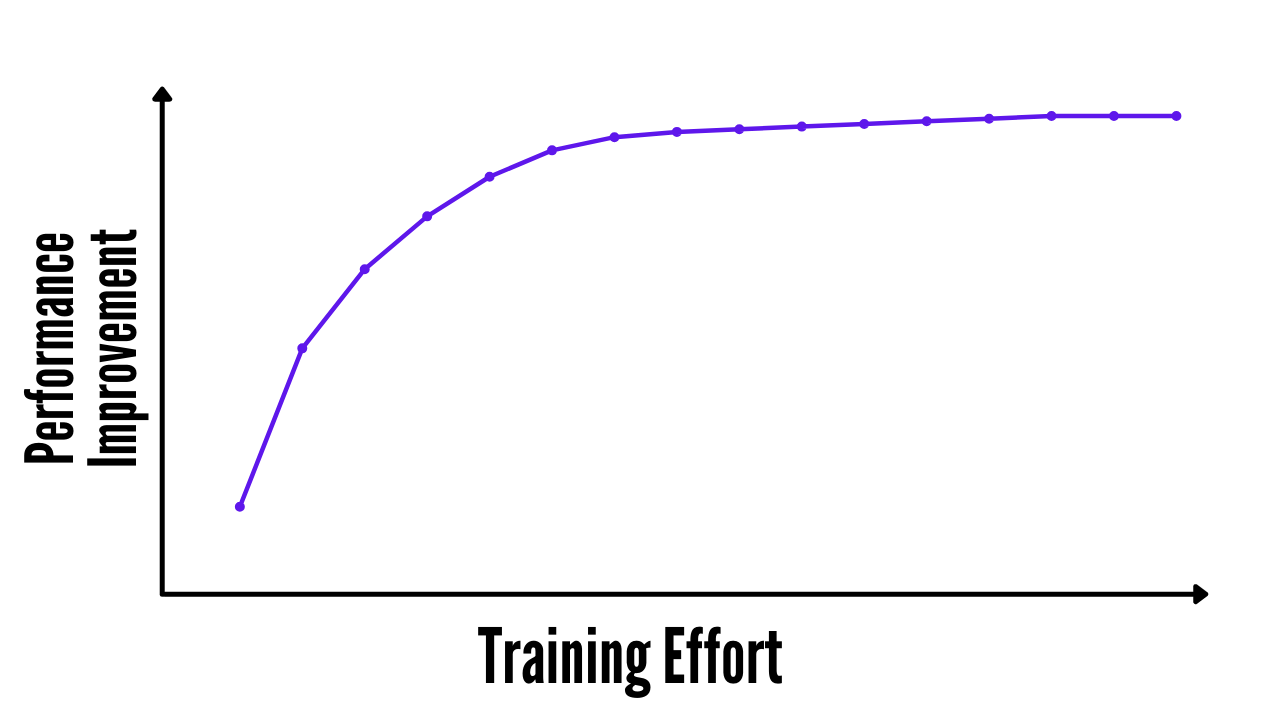
Since Carri’s training is all at the same pace, the stimulus applied by her training is always the same. Her body adapts to this stimulus by becoming more efficient at running. This is the training effect. Once she has adapted to that particular pace of running, repeating that each week only serves to maintain the improvements she has made. This leads to a plateau in performance.
Now Carri knows her lactate threshold pace and heart rate and she intends to use this information to vary the stimulus applied by each run. Previously, a typical training week for Carri might look something like this:
- Monday = Rest
- Tuesday = 5km
- Wednesday = 5km
- Thursday = 8km
- Friday = Rest
- Saturday = 5km
- Sunday = 10-14km
Carri would just run each workout at pretty much her 10k pace. So for most of the runs, Carri’s average pace was around 6:20 min/km. For the next 4 months, Carri will stick to the same amount of training, but she’s going to be more strategic with her intensity.
This is how Carri’s training looks now:
- Monday = Rest
- Tuesday = 5km @ Zone 3 Pace
- Wednesday = 5km @ Zone 1 Heart Rate
- Thursday = 8km @ Zone 2 Heart Rate
- Friday = Rest
- Saturday = 5km: Interval Run = 8 x 30 seconds @ Zone 5 pace with 2 minutes recovery each
- Sunday = 10-14km @ Zone 2 Heart Rate
Using zone 1 and 2 heart rate as a target for the majority of her runs will significantly slow Carri down. This takes a little adjustment. She normally runs her Sunday long-run at around 6:20-6:40 min/km pace. Now she has reduced it to keep her heart rate in zone 2 and she finds her pace is only around 7:40 min/km. It’s a similar story for the Wednesday and Thursday runs.
These slower runs will help Carri target her aerobic development by ensuring that the vast majority of her energy is garnered via the oxidative system. Her oxidative system will be stimulated to adapt and improve in efficiency, thus supplying the aerobic base she will need. To get a little more detail on these adaptations, check out this post…
Related Post
The added benefit of all this slower running is that Carri doesn’t feel so tired. Each week she looks forward to her Tuesday and Saturday workouts. On Tuesday she can hit 6:20 min/km for the whole 5km. On Saturday she bangs out her intervals with relentless accuracy, hitting 4:30 min/km for every 30-second interval. It’s hard, but she is determined to push it on those workouts.
These harder sessions stimulate adaptations in Carri’s anaerobic energy systems. Her muscle cells are encouraged to store more ATP and Creatine Phosphate for quick energy access via the phosphagen system. Her muscles grow denser capillary networks, improving her ability to shuttle lactate off to the liver. This can be returned as glucose for further use by the glycolytic system.
Now, Carri’s easy runs are really easy and her hard runs are really hard. The easy runs stimulate big adaptations in Carri’s aerobic capacity (oxidative system). The hard runs stimulate big adaptations in Carri’s anaerobic capacity (phosphagen and glycolytic systems). These improvements combine to make Carri fitter.
Carri can feel the difference after 8 weeks and decides to repeat the 20-minute lactate threshold test. This time she runs 3.66 km with an average pace of 5:27 min/km and an average heart rate of 169. She plugs those numbers into my zone calculator…

Carri is super excited. Her lactate threshold heart rate has stayed the same. However, her lactate threshold pace has improved to 5:56 min/km. Since Carri knows her lactate threshold pace is roughly the pace she can sustain for one hour, she now knows that she could sustain 5:56 min/km for up to an hour. If she hits that pace on race day, she’ll finish her 10k in under 60 minutes.
10k Race
4 months later Carri is towing the line at her 10k race. She’s nervous but excited. For the last 8 weeks, she has been using her new pace zones that came from her second lactate threshold field test. She has been tapering over the last week and feels very fresh.
As the gun goes off she heads out at 5:30 min/km. After a couple of minutes, she checks her GPS watch, realizes she is going too quickly and slows down to 6:00 min/km pace. After 30 minutes at 6:00 min/km she’s struggling, her legs are burning and she’s breathing hard. She wants to slow down, but she is confident in her pace. Her field tests suggest she could sustain a 5:56 min/km pace for an hour. She decides to trust in the system and maintain the 6:00 min/km pace as long as she can.
At 50 minutes, she checks her GPS watch. She’s covered 8.3 km with an average pace of 6:00 min/km. She’s really struggling now, her quads burn and she sucks at the air desperately, but she doesn’t need to slow down yet. She passes the 9 km mark at 54 minutes, if she can finish this last kilometre at 6:00 min/km pace, she’ll beat her PR and get in under 1 hour. Carri increases her pace a little, now she’s at 5:30 min/km. This really hurts, but there are only 500m left. She digs deep, increases her pace a little more, 5:15 min/km. She knows she can’t keep this up much longer, but the finish line is in sight.
She crosses the line, braces her hands on her knees and chugs desperately for air. She affords a quick glance up at the finish line clock. 00:59:40.
Now that we understand how the energy systems work and how that relates to our lactate threshold, we need to dig into training zones in more detail. In the next module, you will learn the fundamentals of heart rate zone training.
Next Module

The Running Fundamentals Course is a free online course to help runners understand the foundations of running performance.
Enter your name and email and I’ll send you one module each week.
