Subscribe to The Adaptive Zone Podcast…
Why are my Running Heart Rate Zones not accurate?
Have you ever wondered why the running heart rate zones on your GPS watch or running app seem way off? So, for example, you feel like you’re running at an easy pace but your watch tells you you’re in zone 5?
What are these heart rate zones for anyway?
This might seem like a small problem, but it leads runners to feel confused and lose confidence in their training. If your heart rate zones seem way off, there is a good chance you will ignore them. That’s a shame because heart rate zones are incredibly helpful for improving your training. In fact, you can also use pace zones to really step up the quality of your workouts. However, if your zones are not calibrated correctly, they will do more harm than good.
So, in this module, I intend to answer the following questions…
- What are the running heart rate zones?
- How do the running heart rate zones relate to running pace zones?
In the next module, we’ll go on to discuss how to actually determine your own running heart rate zones.
What are the Running Heart Rate Zones?
Running heart rate zones are just a way of dividing up the intensity spectrum into chunks to help you target different aspects of your physiology with different workouts.
Most runners know that running slowly is more aerobic and running fast is anaerobic. However, it’s not just a switch between the two. We have an entire spectrum of intensity. We have a range of physiological mechanisms to achieve these outputs. During a race we call on all of them, so we must train all of them.
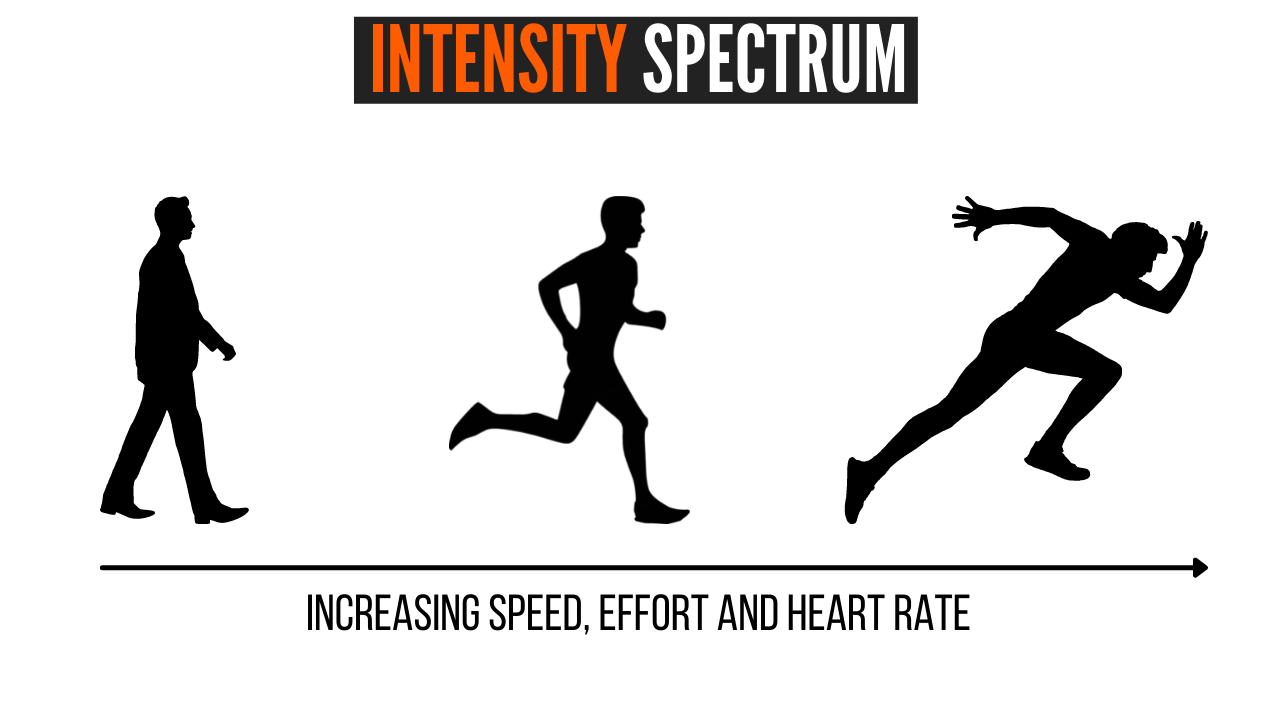
When we walk we can go for hours without stopping. When we sprint we start to slow down within a matter of seconds. As we go from walking to jogging to running to sprinting, our heart rate will increase in proportion to the increase in intensity. Basically, the faster the pace, the faster the heart rate. We can think of this gradual increase in pace and heart rate as our intensity spectrum.
Lactate Threshold
In my article on lactate threshold, we discussed how Sports Scientists investigate a runner’s response to a gradual increase in exercise intensity. They put the athlete on the treadmill and have them gradually increase their pace. This will gradually increase their heart rate. All the while, they take pinprick samples of the athlete’s blood and test it for the concentration of lactate.
Previous Module
At the end of the test, they plot the heart rate against the concentration of lactate and see a hockey stick chart. At first, the concentration of lactate in the blood rises only very slowly as the pace and heart rate increase. However, at a certain point, the concentration shoots up rapidly. We call that the lactate curve.
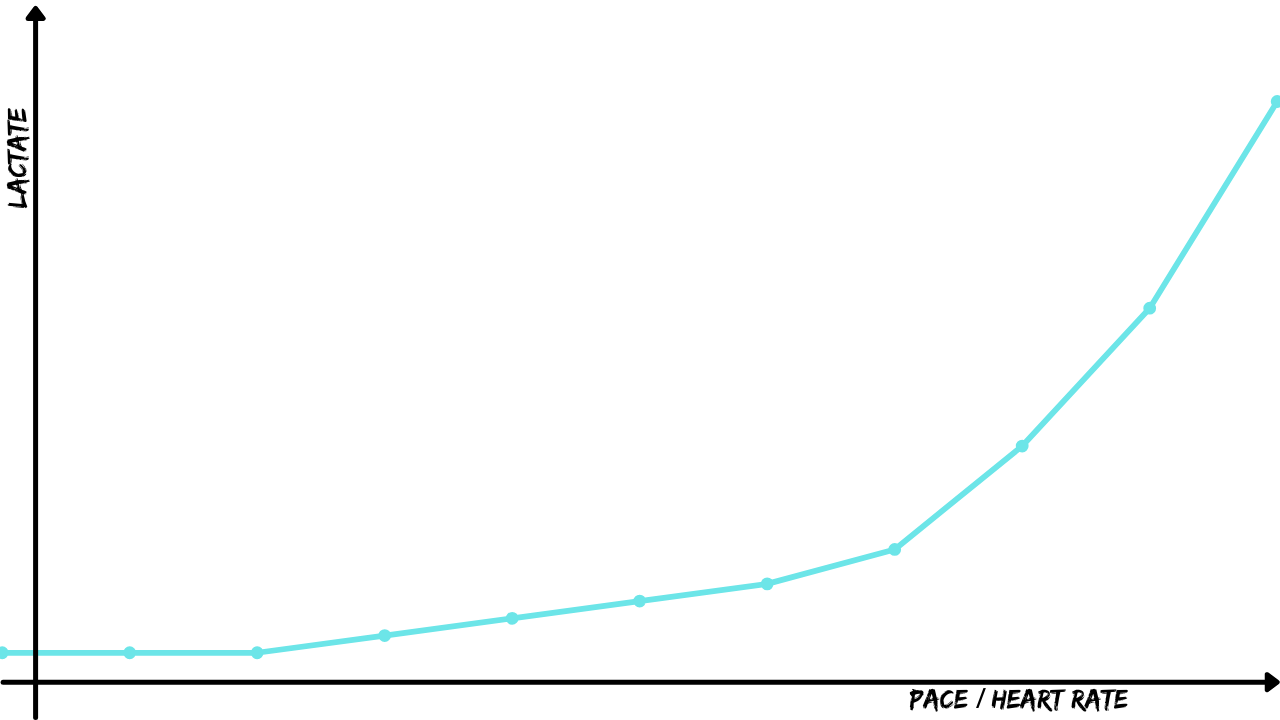
The point at which it shoots up rapidly is the point at which lactate is being generated faster than it can be cleared. As we discussed in my article on energy systems, this is because there is a larger contribution to energy production via anaerobic glycolysis. For this reason, it is sometimes called the anaerobic threshold, but I usually refer to it as the lactate threshold.
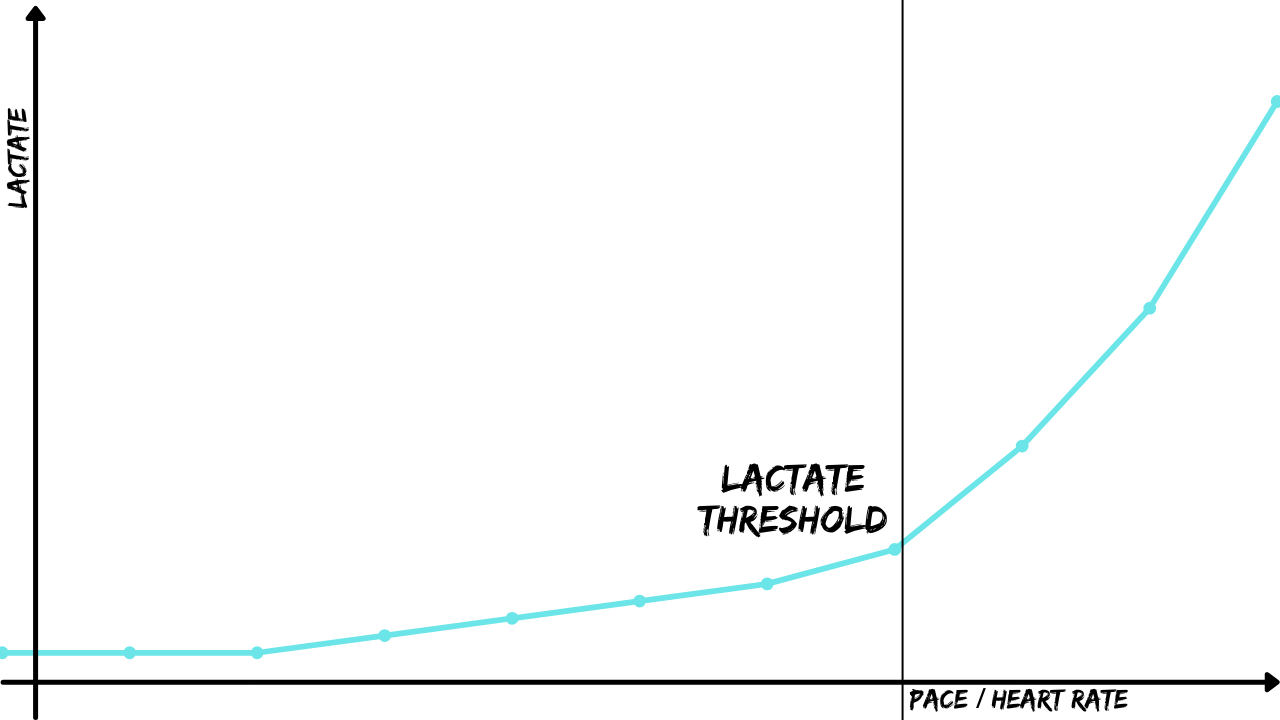
The most simple zone systems have the intensity spectrum divided at this point, an aerobic zone and an anaerobic zone.
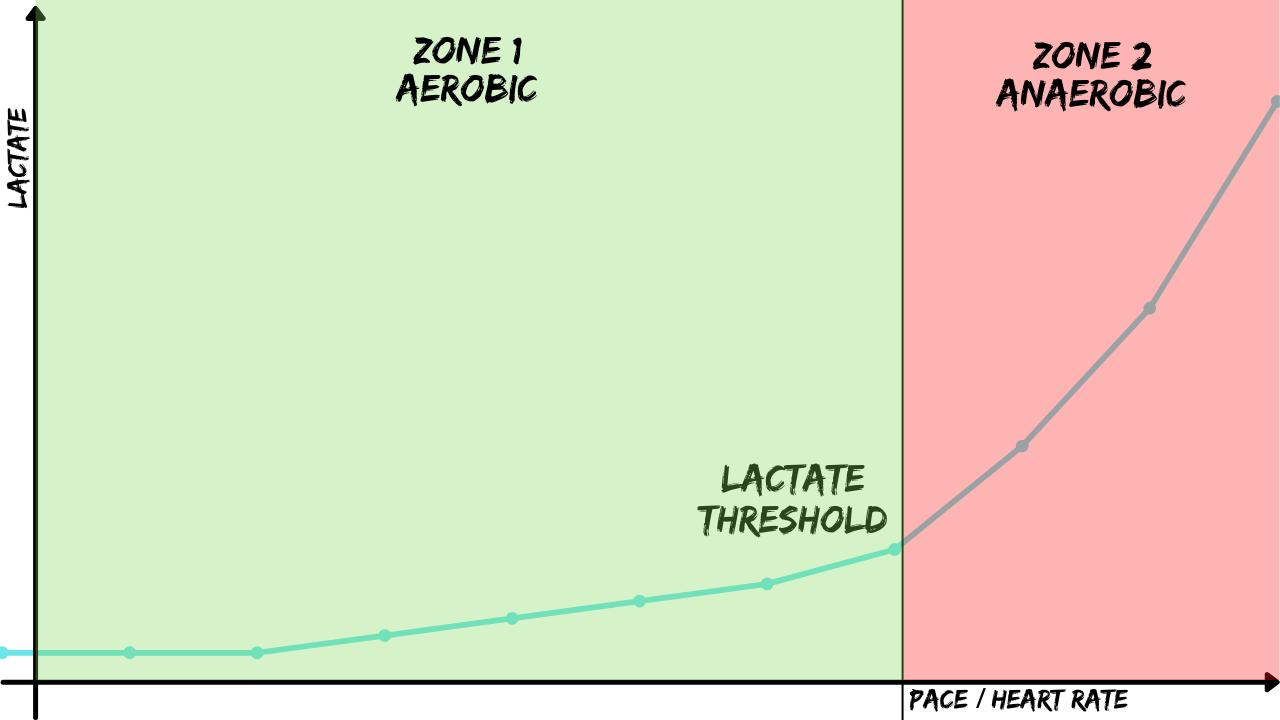
This is not a bad start. You could divide up your runs into “easy” and “hard” runs. For the easy runs you would keep your heart rate below the lactate threshold and work on your aerobic system. For the hard runs, you get the heart rate up above the lactate threshold to work on the anaerobic system. This is a simple system and would actually be very effective when compared to simply running all your runs at a moderate intensity (which is a very common problem).
Two Lactate Thresholds?
This system is simple but it’s not very sophisticated. If we want to be more specific we’re going to need to divide up this intensity spectrum into a few more zones. However, this is where much of the confusion arises. There are a bunch of different zone systems out there. They use different cut-off points for the different zones and this can be very confusing.
So in order to make this easier to understand, we’re going to add a few more physiological points to our spectrum. We have discussed the lactate threshold as the point at which the concentration of lactate starts to rise rapidly, however, there is another lactate threshold. This is the point at which lactate starts to rise in the blood just a little bit.
The level of lactate in the blood usually sits below 2mmol. As we start to increase our intensity just a little, the level of lactate in the blood will rise to over 2.5mmol. This would represent an increase from a pace at which we can easily talk in full sentences to one where we breathe a little heavier. For this reason, it is often called the first ventilatory threshold or VT1. However, since it also represents the first change in lactate level in the blood, it is also known as the first lactate threshold or LT1.
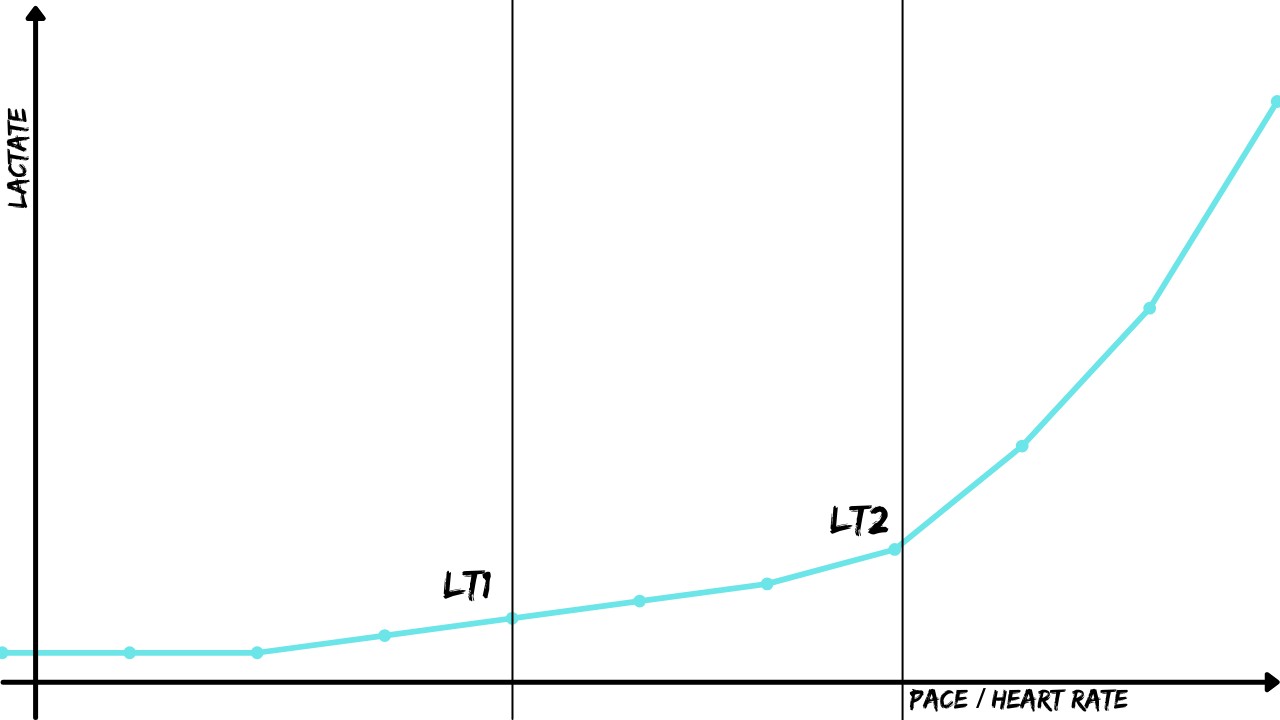
Now, we are getting somewhere. We can divide this graph up into 3 zones with aerobic training below LT1 and anaerobic training above LT2. In between, we have a zone that is neither targeting the aerobic nor the anaerobic but a combination of the two. This zone is often called the threshold zone.
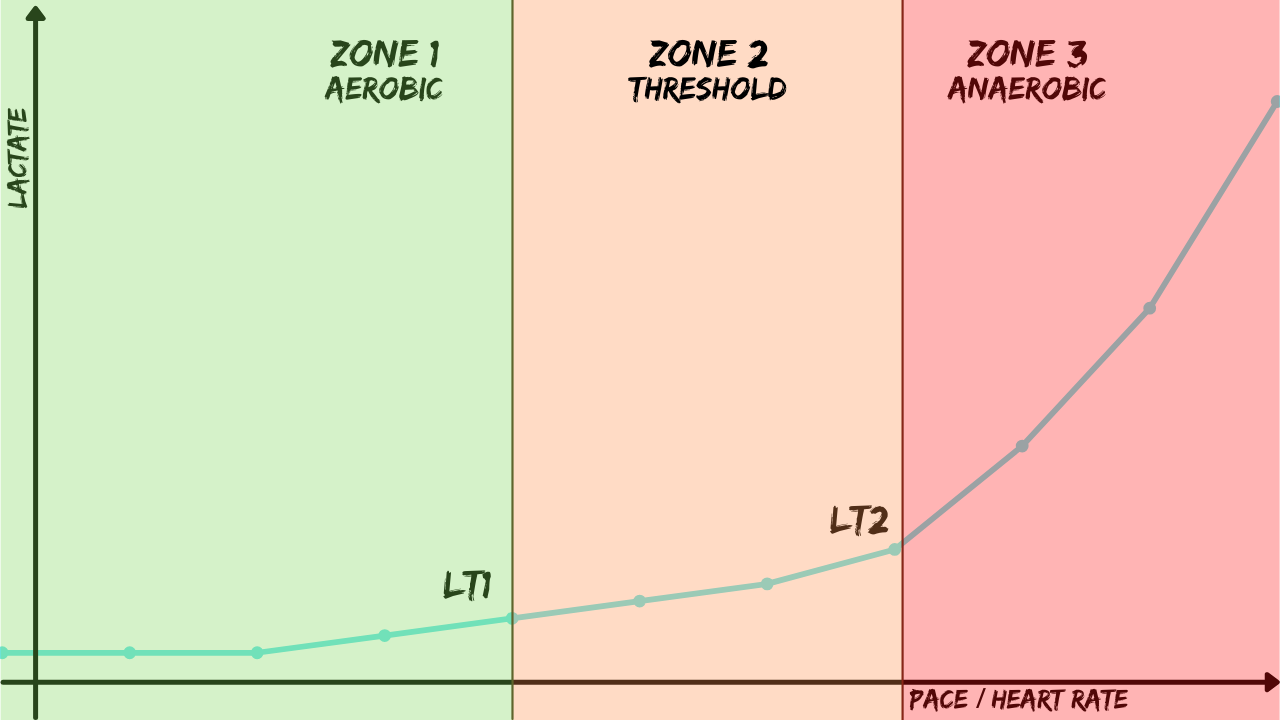
Aerobic runs are things like long-slow-distance runs or endurance runs. Anaerobic runs are sprint intervals or hill-sprints. Threshold runs are things like tempo runs.
This three-zone system is actually pretty much all we need as recreational runners. Dividing up our training into aerobic runs, threshold runs and anaerobic runs would be a fantastic way to make sure we target all areas of the intensity spectrum. Targeting our runs like this allows us to focus the workout toward a particular physiological adaptation.
Aerobic runs will focus on improving our endurance by targeting the oxidative system. Threshold runs will generate sustainable amounts of lactate through the glycolytic system, thereby forcing us to improve lactate clearance. Anaerobic runs will improve our top-end speed by targeting the phosphagen system. As discussed in the module on energy systems…
Related Module
VO2 Max
Okay, now we have a couple of very helpful physiological markers on the board. Now, we’re going to add in our most famous physiological marker, VO2 Max.
Many of you will remember VO2 Max from high school biology. It’s the maximum amount of oxygen your body can use within a period of time (usually one minute). My Garmin estimates I can use 52 mL of oxygen per kg each minute. Elite athletes can use as much as 90 and Wikipedia tells me an Alaskan husky can use over 200!

Our VO2 Max pace and VO2 Max heart rate is the heart rate at which we are using as much oxygen as we are able. Let’s add that number to our graph.
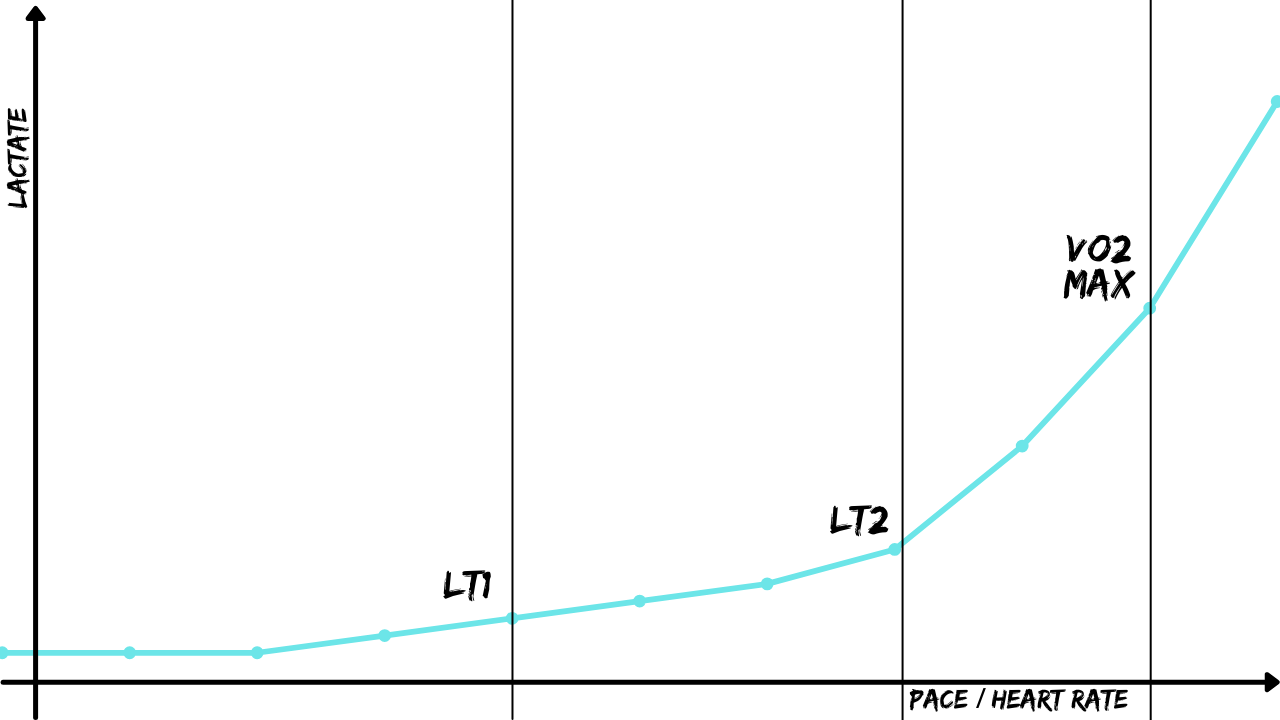
As you can see, our VO2 max is not the highest heart rate or pace we can reach. Once we have maxed out the oxygen usage, our body just goes anaerobic. If there is no oxygen around the muscles will just use anaerobic glycolysis and keep churning out the ATP. It’s not a very efficient use of our glucose, but hey, desperate times…

Aerobic Exercise
Now, this last point is a tricky one. We have 3 physiological markers on our graph. That would allow us to divide the intensity spectrum into 4 distinct zones. However, at the minute, the first “zone” is a pretty big range. For example, my LT1 heart rate is roughly 145 bpm. My resting heart rate is about 65 bpm. So my lowest intensity zone currently spans 65 bpm to 145 bpm. That is a massive range.
At one of those heart rates, I’m sitting still. Around 80-90 bpm I’m walking. 100-110 bpm I’m jogging. Once I start running I’ll be around 120-130. To get my heart rate up to 140 I actually have to run with a fair bit of effort. You can see the problem here. If my training plan prescribed a “zone 1” run with my current setup, I could reasonably walk it or run it. These are two very different workouts!
We know that walking is good for our health, but if you want to run a marathon, you’re going to have to run. So we need to ask ourselves, what is the lowest intensity of exercise that would actually improve my aerobic system in a meaningful way? This is actually quite a hard question to get an answer to! However, my former podcast guest, Nick Jankovskis, informs me that it’s about 56% of VO2 Max.
Bonus Course Content
Anything below 56% of VO2 max is just too easy to offer enough stimulus to really improve our running endurance. That’s where we are going to put our final physiological marker.
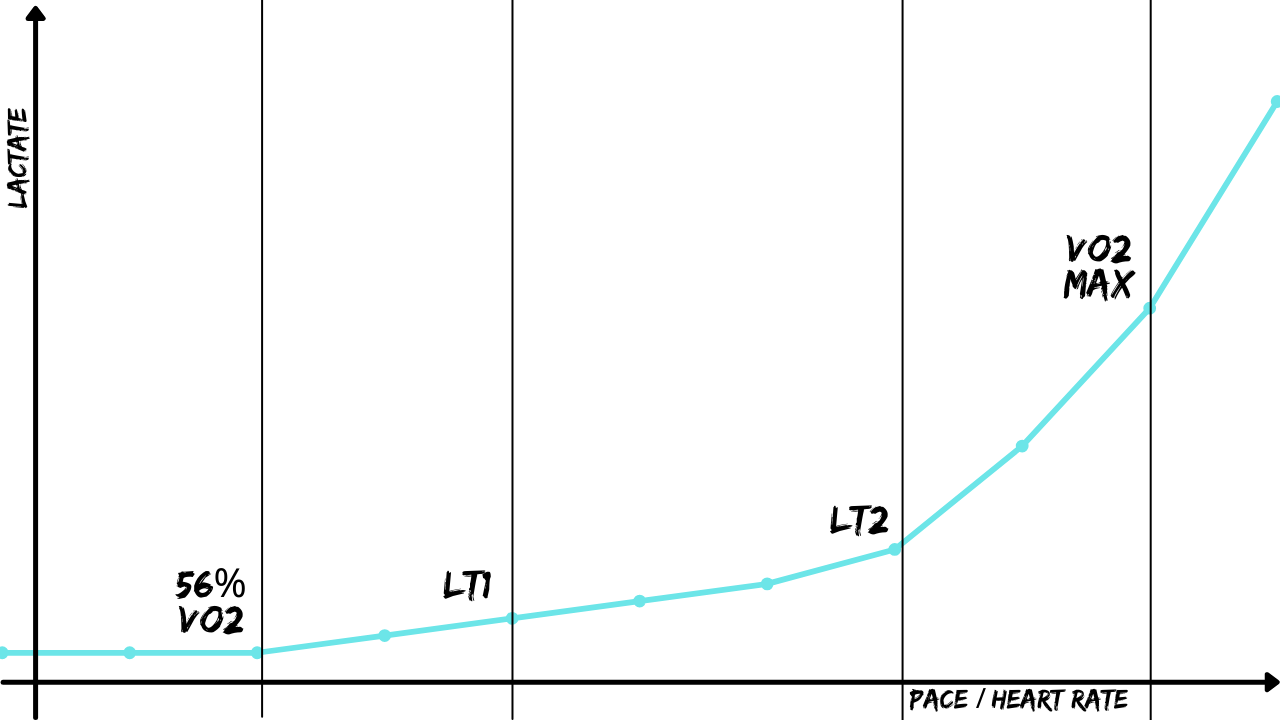
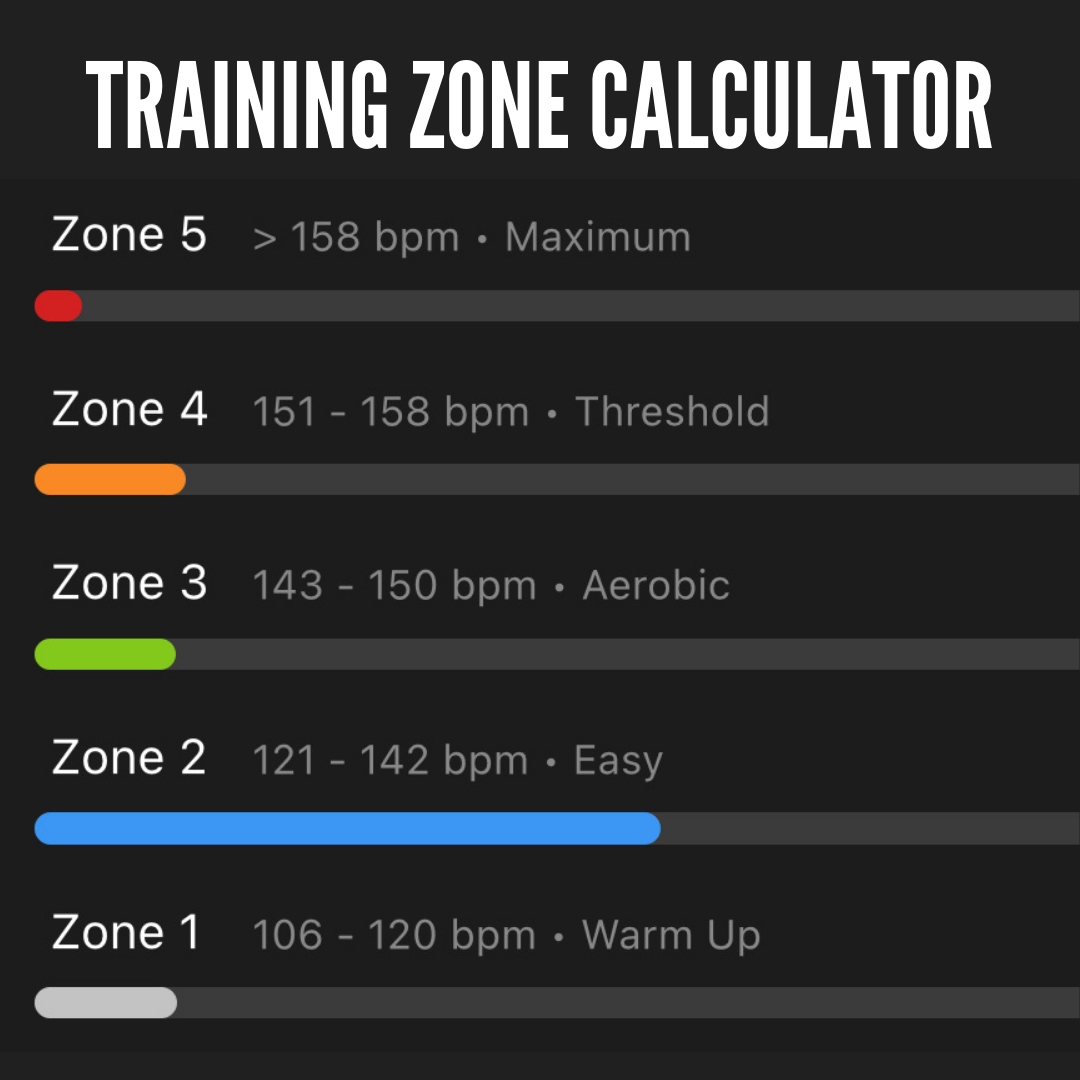
Viola! Now we can establish a 5-zone system. Nick lays it out for us…
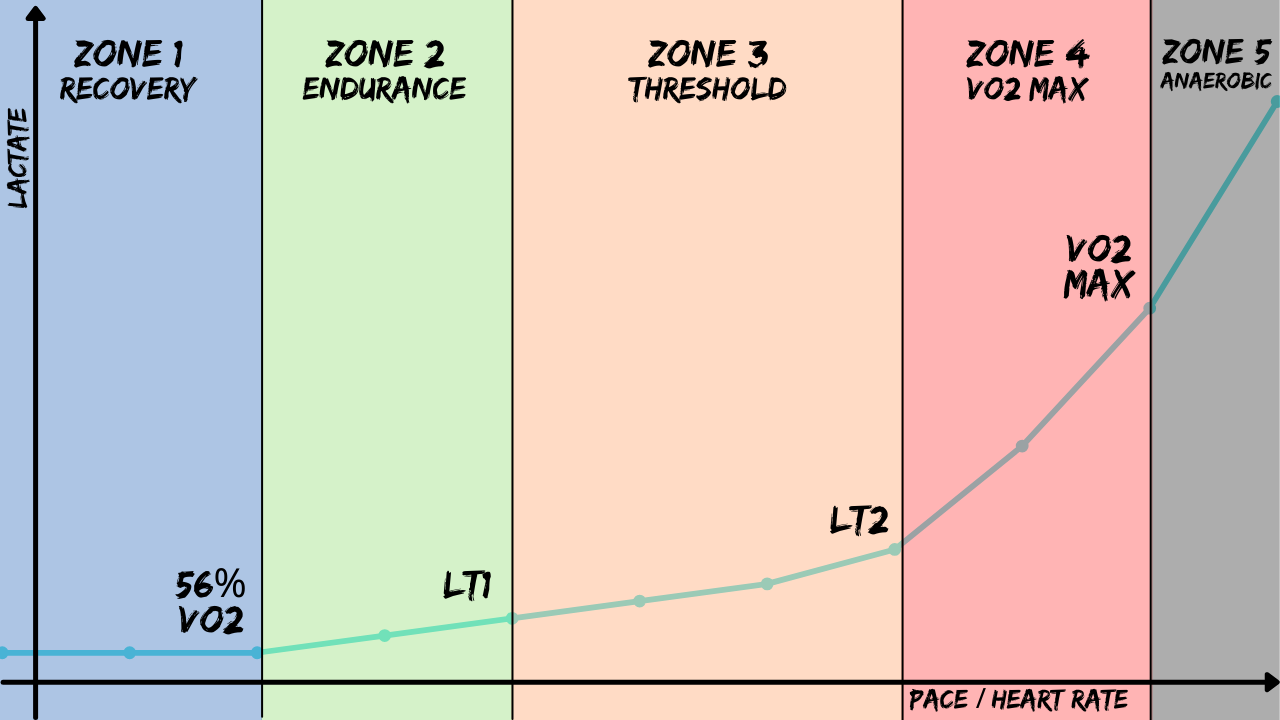
So now we have our 5 training zones.
How do the running heart rate zones relate to running pace zones?
As you progress up the intensity spectrum from walking to jogging to running to sprinting, your pace will be increasing. Your heart rate will be increasing in direct proportion. The faster you run, the more glucose and oxygen your muscles demand, the faster your heart will beat to deliver oxygen and glucose to the muscles via the blood.
So we have a lactate threshold heart rate (e.g. 159 bpm) but we also have an equivalent lactate threshold pace (e.g. 04:35 min per km). In fact, those two values are my lactate threshold heart rate and pace as of a recent test. That is a pretty good estimate for the pace at which my blood lactate would start to rise exponentially. At that pace, I can be expected to run for 60 minutes before failure (as discussed in the lactate threshold article).
So for each of the points discussed above, LT1, LT2 and VO2 max we have a heart rate and a pace. These should match up reasonably well. Say I’m running along with a steady heart rate of 159 bpm, which is my current LT2 heart rate. I should expect to see that my pace is around 04:35 min/km because that is my LT2 pace.
This certainly isn’t an exact science. There are many things that will make a specific pace harder or easier to sustain on any given day. This will affect your heart rate at a given pace. However, generally speaking, the two will line up most of the time. This means that we can work out some running pace zones and some running heart rate zones and they should line up with each other fairly well.
For that, we’re going to need some training zone calculators. As luck would have it, that’s the next article in this series…
Next Module
Power Zones
Quick side note. If you're a cyclist or triathlete, you can do the exact same thing with power. For a given effort on the bike, your heart rate will be at the second lactate threshold (LT2). Your power at that effort will be your lactate threshold power (LT2). Same for VO2 max heart rate. You can then use that LT2 power value to work out your power zones in the same way. This is often referred to as Functional Threshold Power (FTP). Training Peaks has a selection of calculators that you can put you LT2 power in to calculate your Power Training Zones.

The Running Fundamentals Course is a free online course to help runners understand the foundations of running performance.
Enter your name and email and I’ll send you one module each week.
